Contents
- Overview
- Location
- Energy
- Construction
- Electrical systems and Photo Voltaic roofing (detail)
- Appliances
- Expected Energy Budget
- Actual energy production and consumption <===
- Bamboo for flooring and in the garden
- Water conservation
- floor plans and elevations
- Tracking actual progress
Heating and external temperature
Gas demand varies by temperature
As expected for a house heated with natural gas and using radiant heat, there is a very strong relationship between the external temperature and the amount of energy used for heating. The relationship between "therms" (roughly 100,000 BTU) and "degree days" (number of days * degrees below 65 degrees Farenheit) is very strong (R square > .96). Based upon monthly data for the past year, we seem to be consuming about .18 therms/degree day or roughly 50% of what we were using at our former house, which was about the same size. (This is seen by comparing the lower (Lakeside) to the upper (Orrington) line in the following figure. The Lakeside data reflects a year of operating, the Orrington data are from about 3 years of gas consumption data.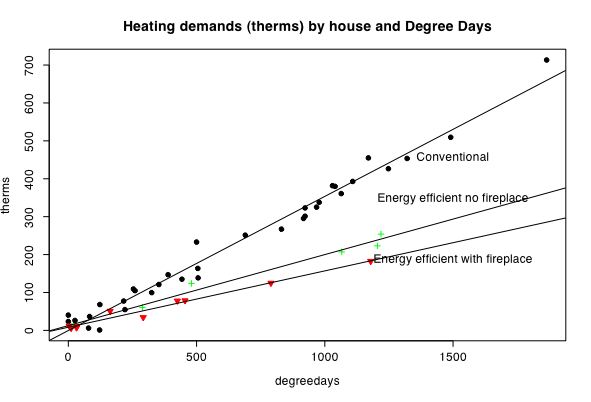
(Taken from a tutorial on using the statistics program, R.)
Electrical demand also varies by temperature
What is less obvious is that a similar (although weaker) relationship also holds between the outside temperature and the amount of electricity consumed. This was originally suggested in the seasonality of electrical consumption but becomes more obvious when we examine the relationship between daily low temperatures and electrical consumption. The first graph examines the relationship of time of year with electrical consumption. The line is a "lowess" fit (local best fit) taken of 3/10 of the available data. What is shown by this figure is that electrical consumption is very sensitive to time of year and varies from about 30 kwh/day in December/January down to about 16-18 during the summer. Last year I had attributed the difference between Jan/Feb and June/July to the house being under construction during the winter. Now, with another year's worth of data, I am afraid that it is due to seasonal demands upon our consumption.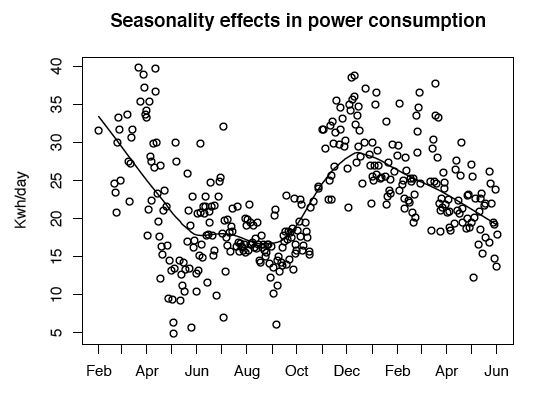
Based upon further analyses of the relationship between the daily temperature and power consumption, we can see that the seasonal effect is strongly related to the outside temperature (just as it is with the heating demand for gas).
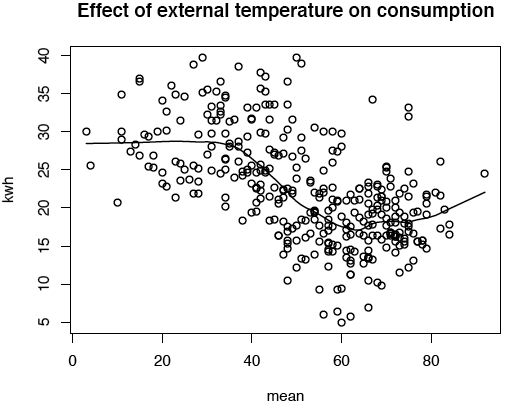
I suspect that the temperature effect, and the resulting seasonality, is due to the power required to drive the pumps for the radiant heating. Fitting this with a local smoothing function suggests that this relationship holds from the lowest measurement (7 degrees) up to about 60 degrees, at which point the function flattens out.
Net production is less than expected
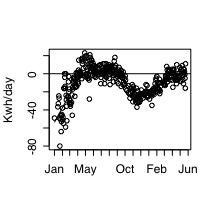
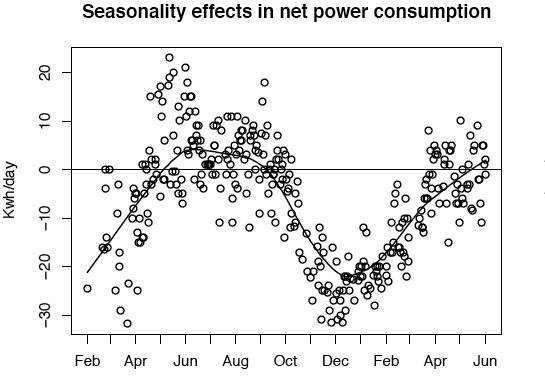
The net result of increased power consumption and decreased production in the winter produces a combined curve showing that we tend to use about 20 kwh/day in the coldest months of the winter and produce about 10 kwh/day during the peak of summer. My initial estimates of power consumption, based upon an energy audit completely missed the seasonality effects due to heating and thus our net output is significantly less than I expected.
The first graph plots the observed production of the system as a function of time of year. As expected, it is clear that we produce much more in the summer than the winter.
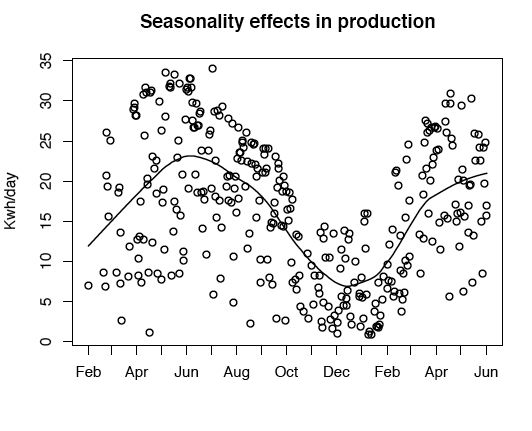
This expected seasonality of production, in combination with the (unexpected) seasonality of consumption leads to the following relationship between time of year and net production (produced - consumed). From late May to early October, we are net producers of power. However, from late October to early May we are net consumers of electricity. Over one year, we are producing, on average, about 65% of our electric power.
Note added in June, 2006. After 3 years we now are up to 80% production of electricity. This can best be seen in the attached graph that removes seasonal effects by doing a 12 month smooth. For up to date graphics on production and consumption, go to my tutorial on using the open source statistical package R for doing graphics.
